Publications » Brochures, booklets or fact-sheets » European Steel in Figures 2021
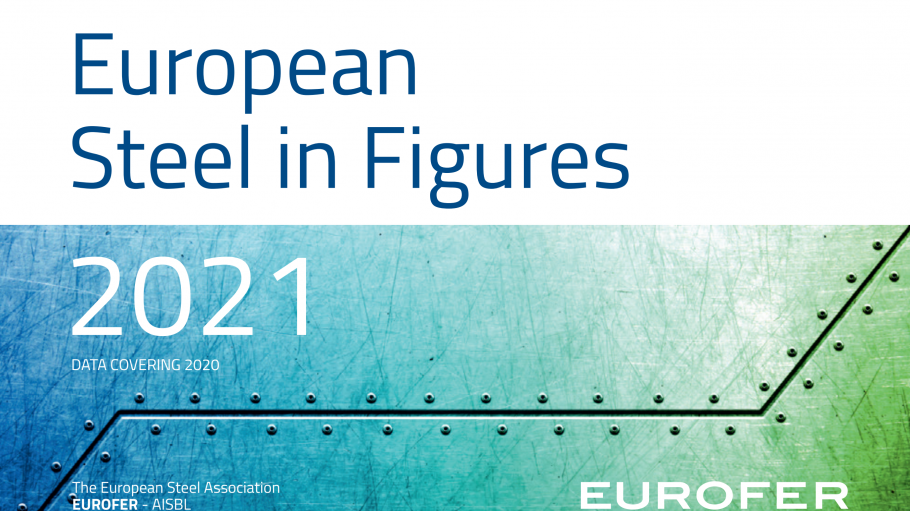
European Steel in Figures 2021
Downloads and links
Recent updates
European Steel in Figures 2020 is the European Steel Association’s (EUROFER) statistical guide. It shows a sector that has experienced a challenging year in 2020, with employment levels having fallen and demand collapsing, largely as a result of the COVID-19 outbreak. In 2020, imports fell further, continuing the trend seen in 2019 but again, largely due to the drop in domestic demand brought on by the pandemic.
This new European Steel in Figures 2021 guide updates the trade map, showing imports and exports from the EU in an easy-to-understand way, breaking down previously hard to read figures. Additionally, the sustainability section of the guide has been updated with the latest 2020 data, now including refreshed information on slag production by the steel industry and its use by other downstream sectors.
All these statistics help give an overview of the European steel industry today. Awareness of the employment, production, demand and trade challenges that face the sector ensure a greater understanding of our strategically important sector. With this in mind, I hope you enjoy using European Steel in Figures 2021.
Download this publication or visit associated links
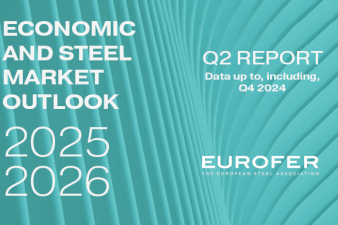
A snapshot of Europe’s steel industry in motion, with EUROFER at the forefront in a time of policy shifts and global uncertainty
Brussels, 05 June 2025 – The high level of uncertainty and major disruptions caused by the new U.S. tariffs have dealt a severe blow to recovery expectations in the steel market for 2025. Against the backdrop of broader economic resilience driven by services, industry remains weak, weighing on steel demand and consumption. Recovery is not expected before 2026, and only if positive developments emerge in the global geoeconomic outlook. According to EUROFER’s latest Economic and Steel Market Outlook, the recession in apparent steel consumption will continue in 2025 (-0.9%) for the fourth consecutive year (-1.1% in 2024), contrary to earlier forecasts of growth (+2.2%). A similar trend is expected for steel-using sectors, with another recession in 2025 (-0.5%, after -3.7% in 2024) instead of a projected recovery (+1.6%). Steel imports remained at historically high levels (27%) throughout 2024.
Second quarter 2025 report. Data up to, and including, fourth quarter 2024

The European Steel Association (EUROFER)
172 Avenue de Cortenbergh
1000 Brussels
Belgium
Email: mail@eurofer.eu
Phone: +32 (0) 2 738 79 20